

Microsoft Data & Ai Solutions
We are one of the implementation partners for Microsoft in their Data and AI space, leveraging the Microsoft Fabric - bringing data into the era of AI.
Contct Us Today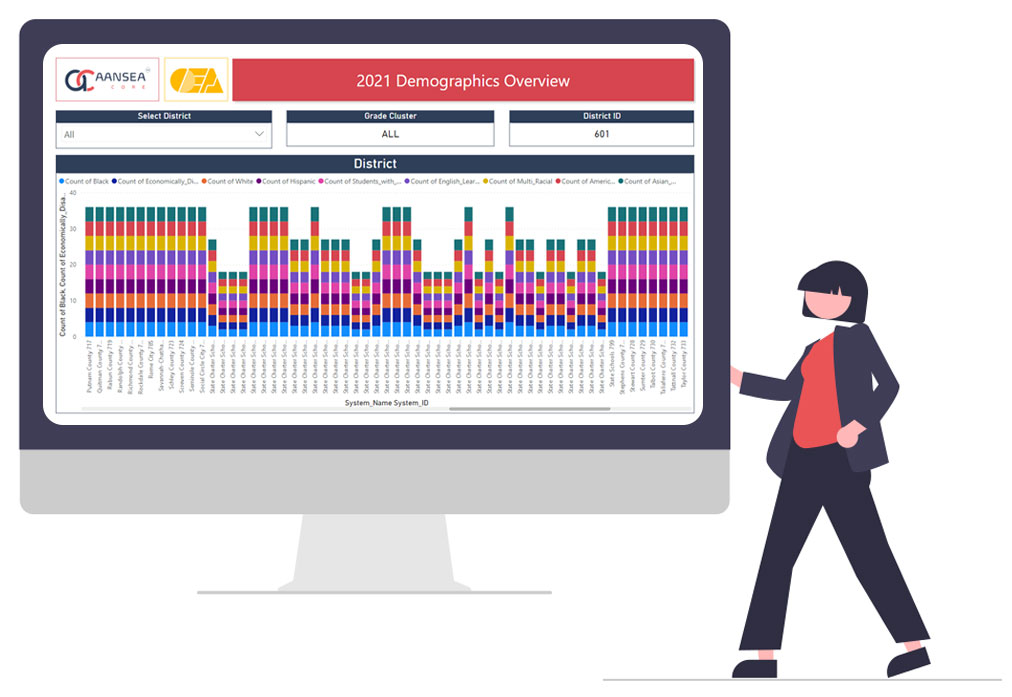
State and National Education Reporting
Making our City/State/Country’s Education Data more real-time and actionable.Faculty and Administrators of Educational Institutions expend considerable time and effort in collecting their institution’s performance data (such as school performance data) and all related information. Even upon collection, lot more time goes into consolidation and analysis, thereby impeding their ability to take data-driven, strategical decisions that are time sensitive.
In order to help the school leaders and key heads, we believe that if an efficient cloud-based solution could do the collection, consolidation and visualization, it would in turn greatly reduce their time, and effort – and that is precisely what we are offering educational institutions. Our solution will also deliver new, more timely generated information in dashboards for improved decision making for all edu-tech leaders and staff
SDS Certification
Being one of the earliest adopters of Microsoft’s technical products, we are proud to have been accredited as a Microsoft Partner in multiple avenues through which we could provide advanced technological solutions to our clients.
our association with Microsoft, our current technical expertise that is closely aligned with Microsoft’s stack includes but not limited to: Azure, Power Platform, Synapse Analytics, SQL Server, Power BI, Productivity Applications, Teams, Visio, Azure DevOps, Project Online.
We actively work with various school districts as a trusted strategic consulting partner, and provide scalable, advanced cloud technology and analytics solutions.
If one of your goals as an ed-tech leader is to analyze your school district’s performance at a larger scale, or your school’s performance, your students’ performance, demographics, pain points, and your overall progress – leverage all these data points and make data driven decisions, we are the right partner that you can trust and connect with today.
Powerful Dashboard Bundles for your Staff and Leadership
Designed in a way to provide powerful and useful analytics and insights to the end-users.The prime outputs of this solution of ours, are dashboards that are designed and developed to visualize the CCRPI data in a way to provide powerful and useful analytics and insights to the and users (principals, other leadership staff as needed)
Intuitive analytics and visuals are provided around key areas including Achievement, Progress, Achievement Gap, Challenge Points, Performance Flags, Star Ratings
An innovative and powerful AI driven data model will be developed by us, tailoring with the requirements of provided by each school.
Intuitive reports and dashboards will be made available on Azure Synapse for the Tech Leaders of Schools
Based on the technological comfort of the Principals, Teachers and the District Leadership – a bundle of intuitive and powerful reports and dashboards, at various levels – ex: career readiness, student opportunity and performance, student achievement, student proficiency, school summary, enrollments, student progress, school progress, gaps in student achievements by school, star ratings, performance flags and many more.
Who can benefit from OEA?

Students
Students are the primary beneficiaries of this solution. They will reap the positive impacts of the right data-driven decisions taken by their staff and leaders.

Parents or Guardians
Parents or guardians are one of the intended beneficiaries of this solution, through which they can have visibility into their ward’s performance and the overall educational institution’s performance.

Educators (Faculty or Teachers)
They will take full advantage of the solution, the insights and will be able to make data driven decisions on areas of improvement for their schools

School System or Institutional Leaders
They will take full advantage of the solution, the insights and will be able to make data driven decisions on areas of improvement for their schools

Researchers
This solution can help as a valuable source of knowledge and insights
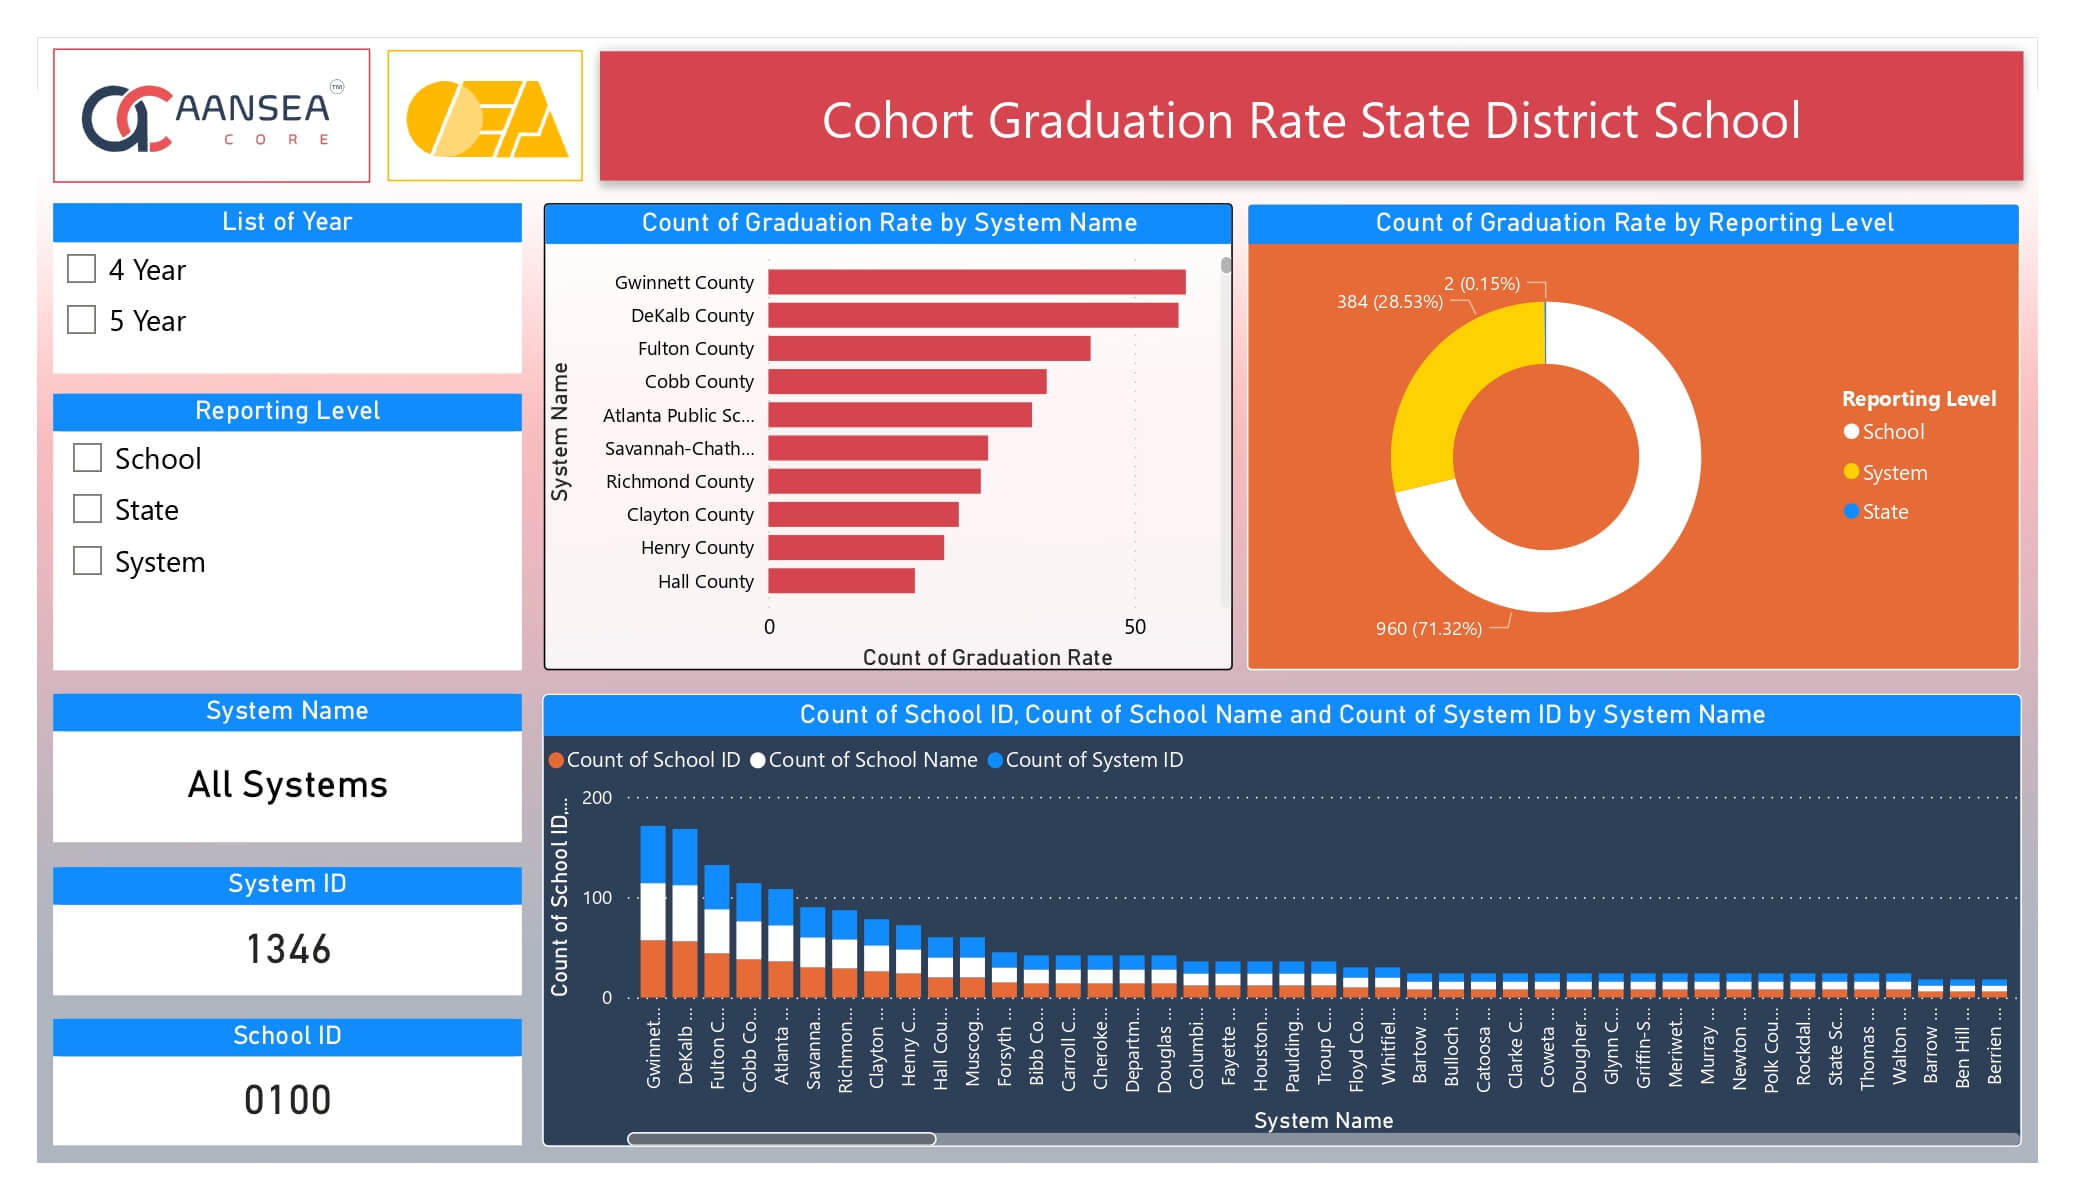
Cohort Graduation Rate Indicator
Cohort Graduation Rate indicates whether the students are graduating from High school with a regular High school Diploma in four or five years.
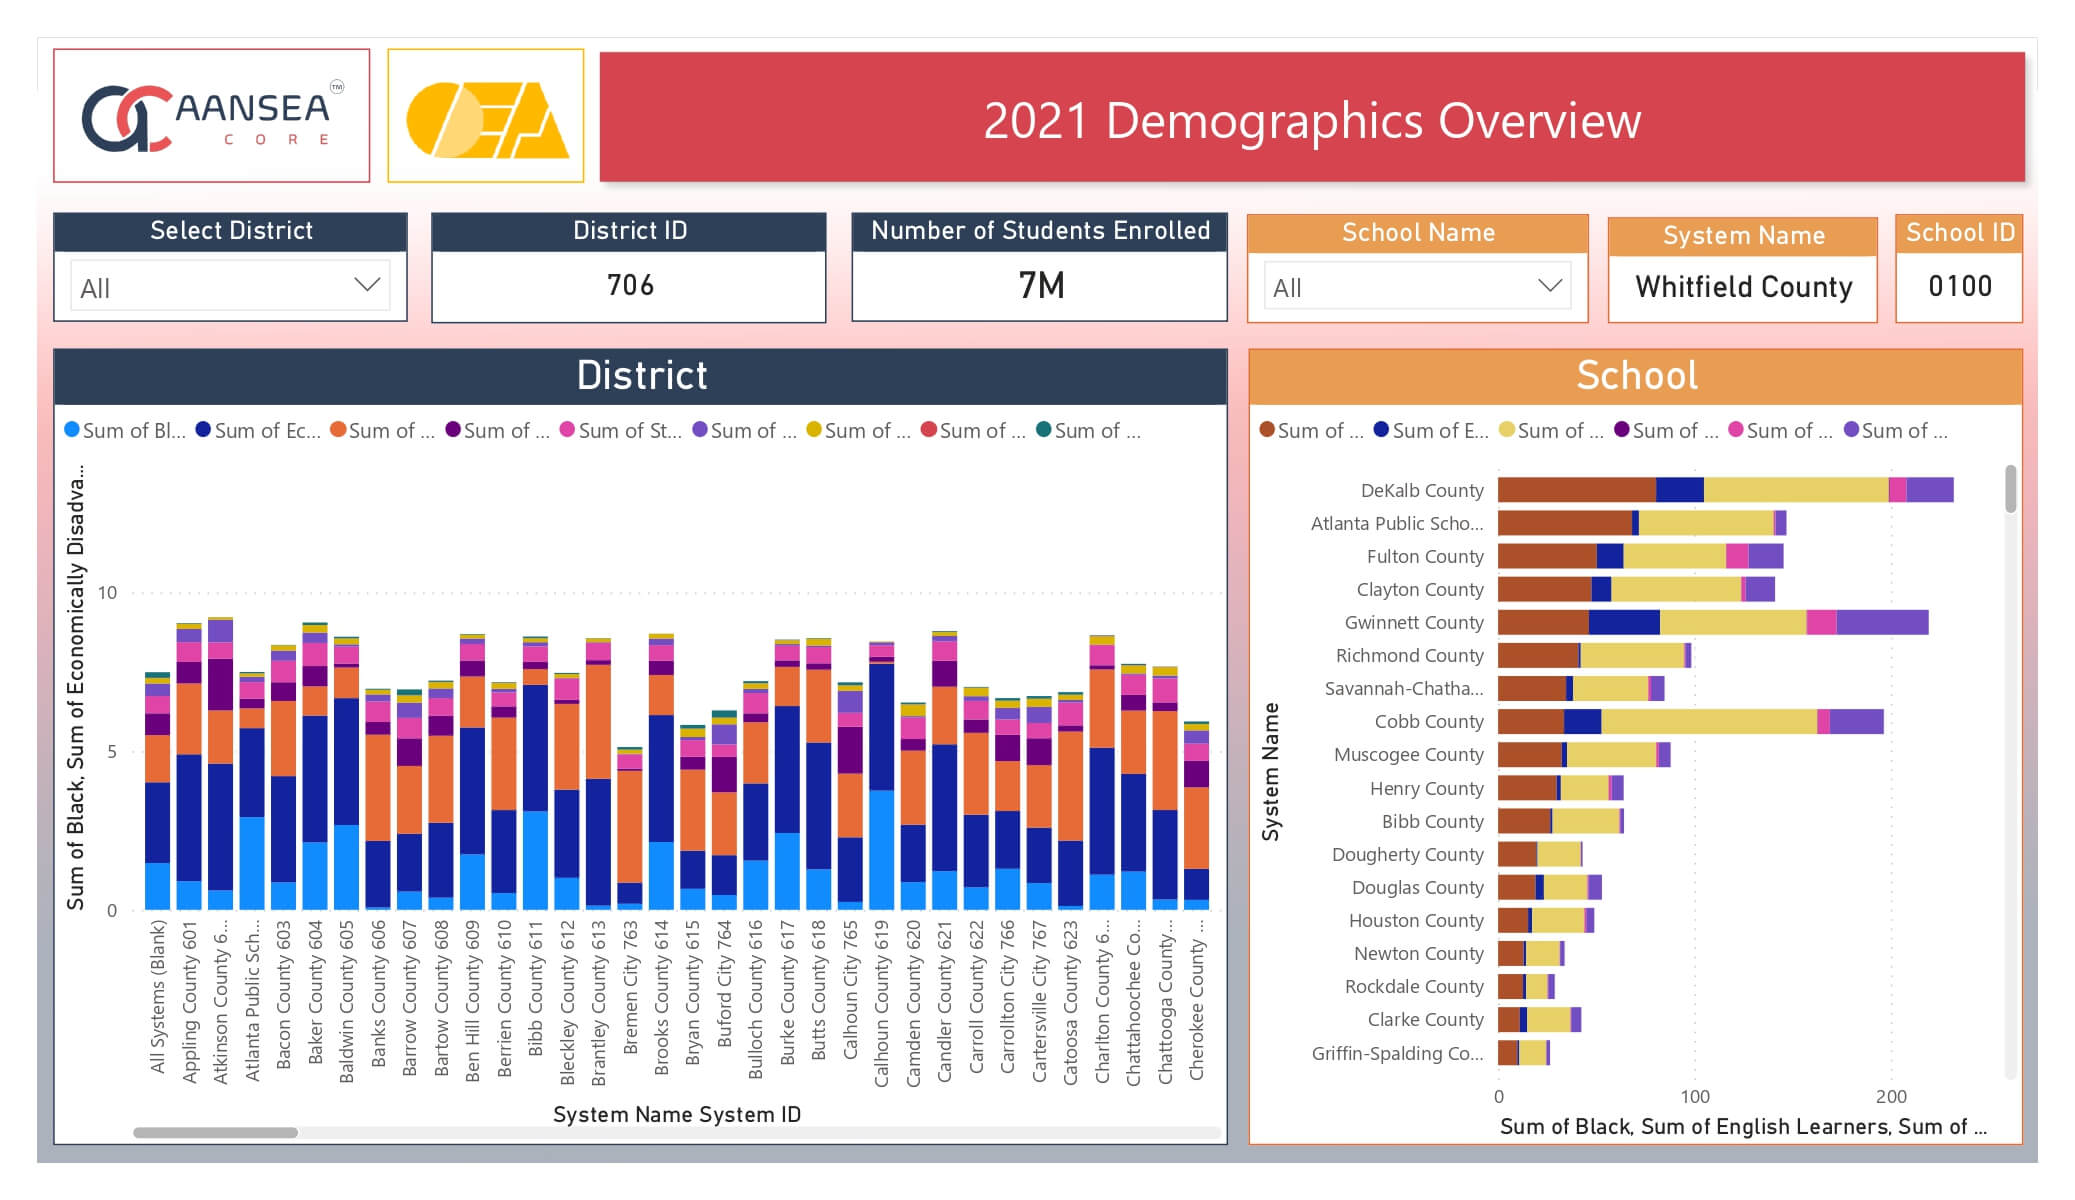
Student Demography Indicator
Demographics indicators help to visualize the population analysis of the students with different ethnicities, economic disadvantage and disability, across counties, districts, and schools.
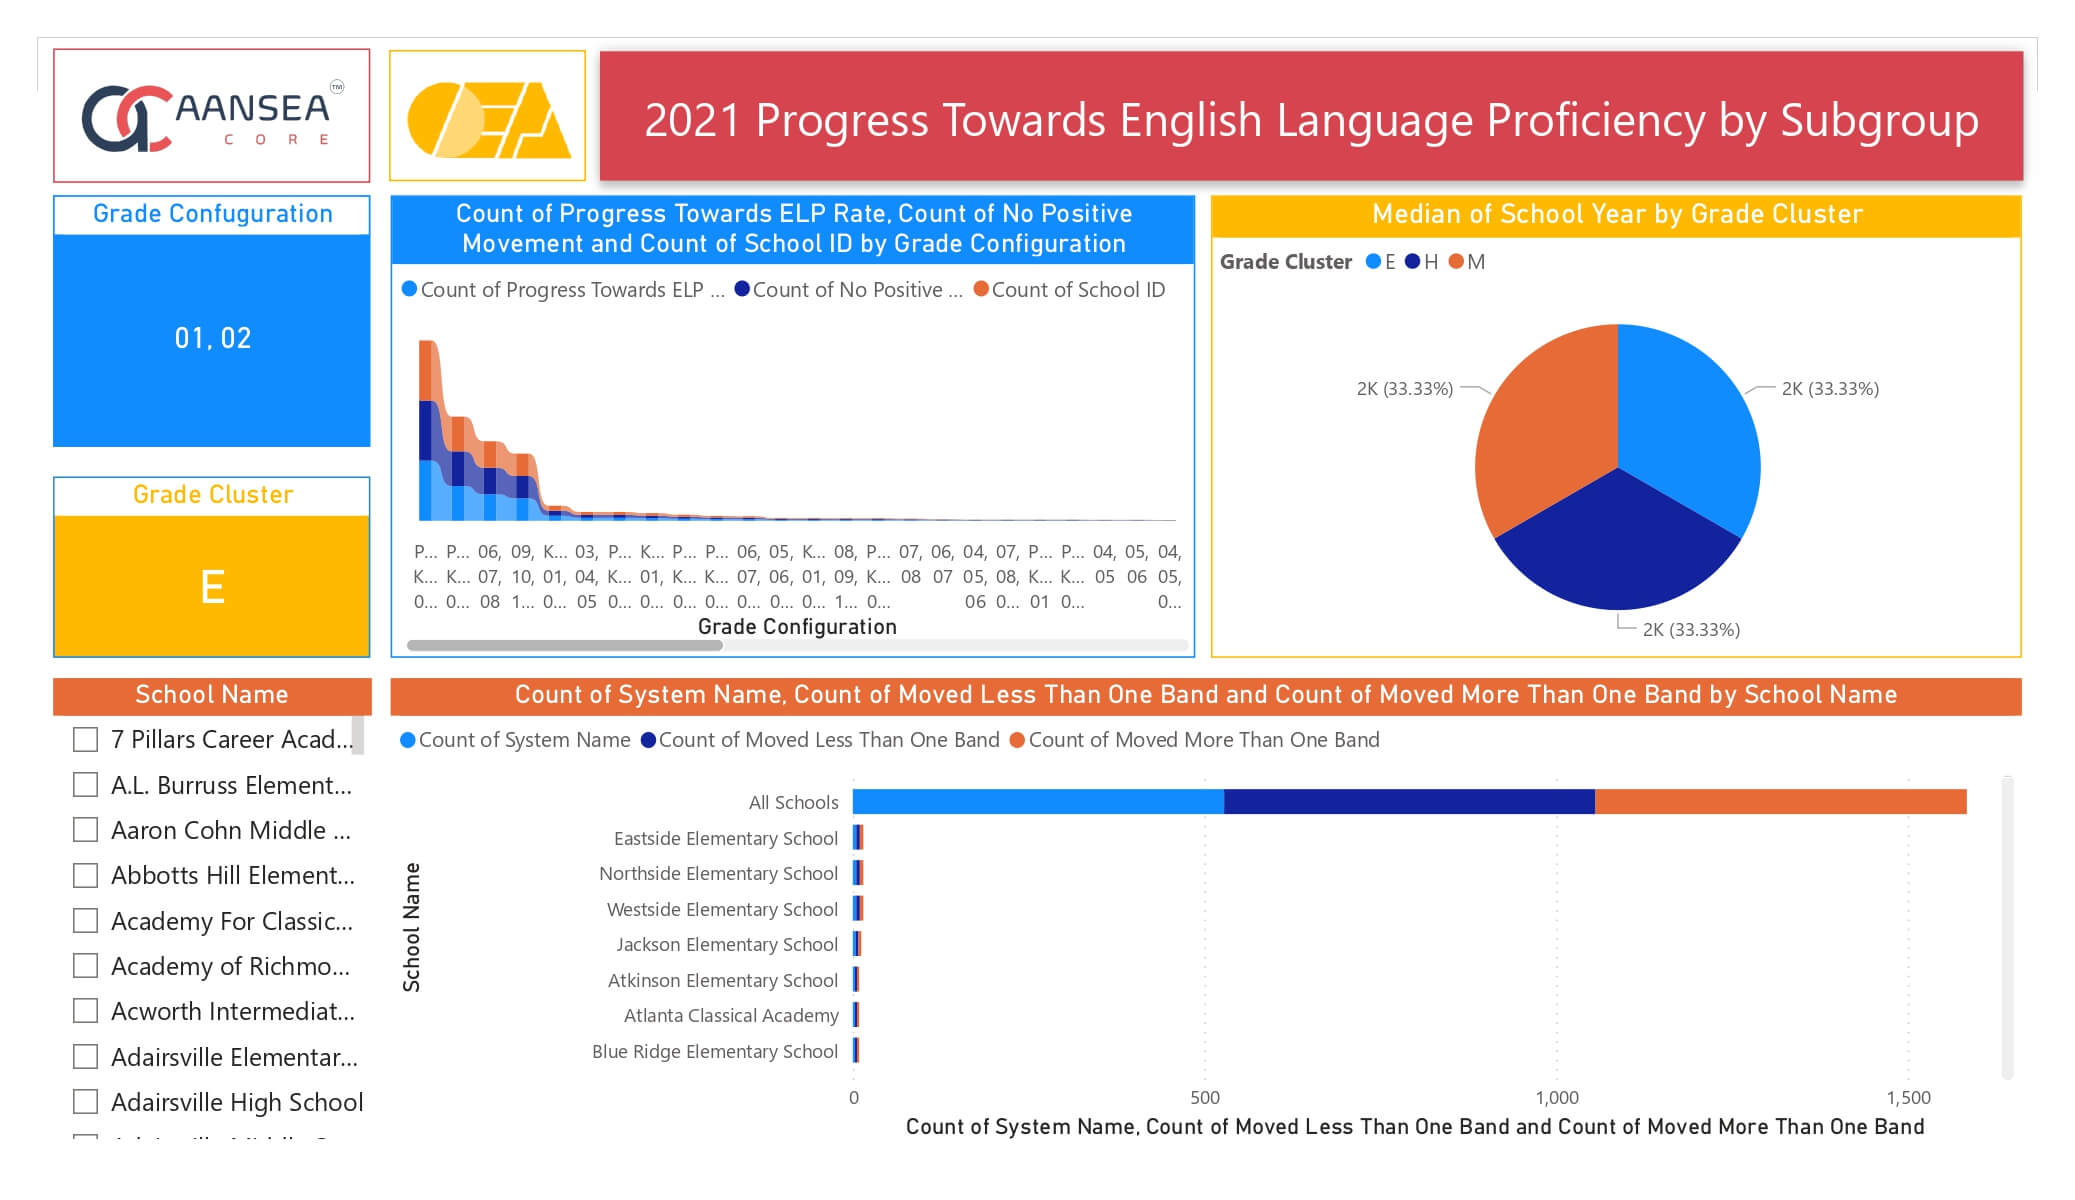
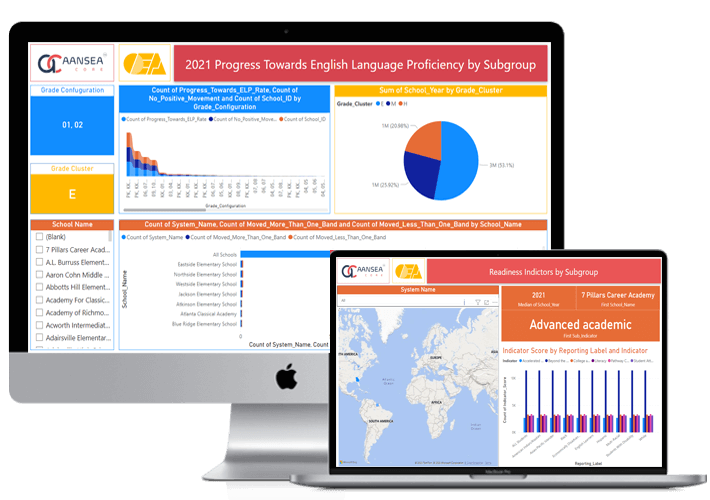
English Language Proficiency Indicator
English Language (EL) Proficiency indicators depict the extent to which the students of English language are making progress, as measured by EL students moving from one state‐defined Performance Band to a higher Performance Band on the ACCESS for the learners.
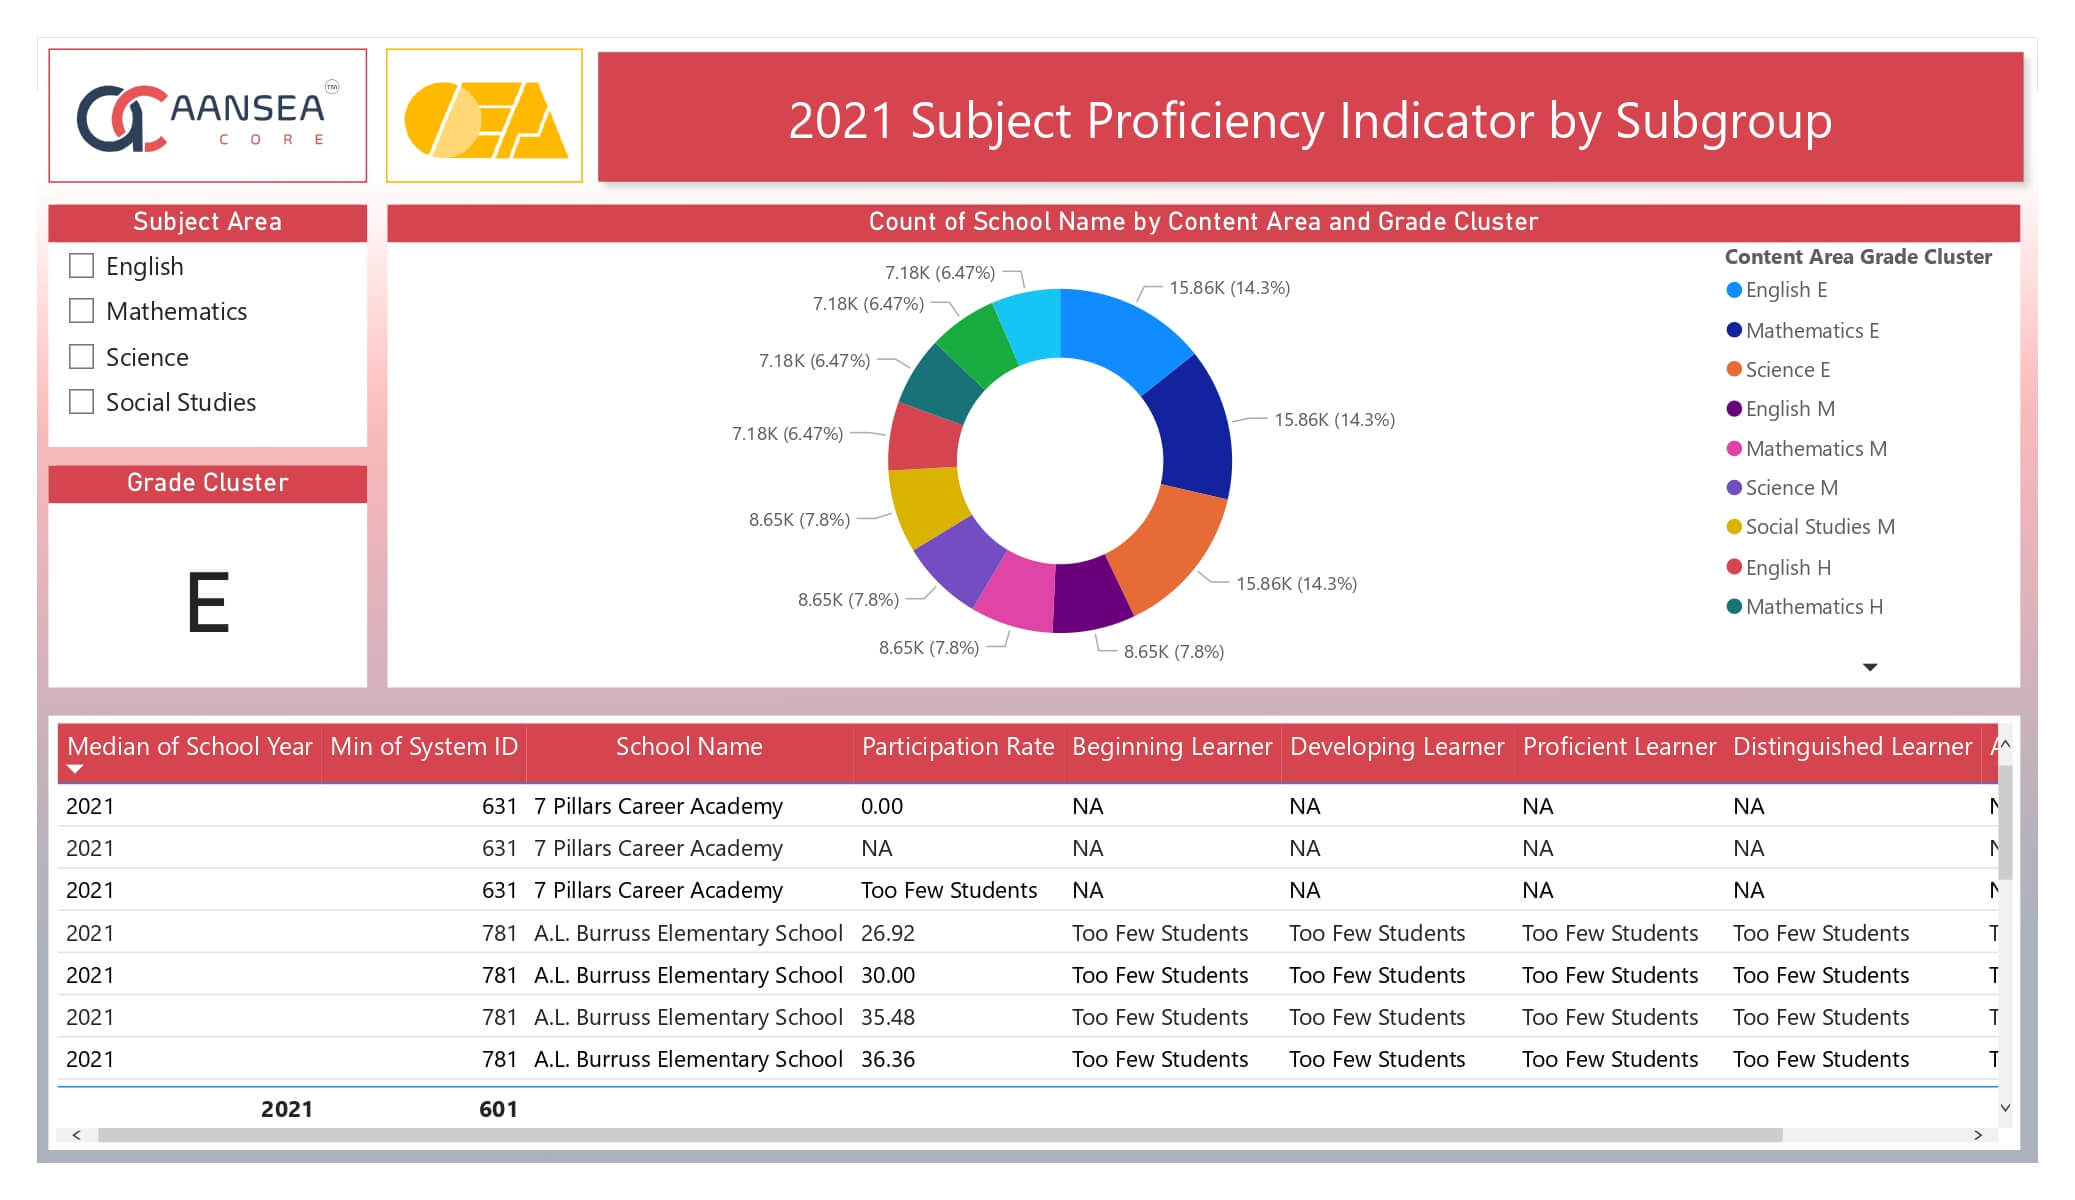
Subject Proficiency Indicator
Subject Proficiency indicators depict whether students are performing at a level essential to qualify for the next grade, college, or career. It comprises the scores achieved by the students in English language, mathematics, science, and social studies based on performance on the State Milestones Assessment System and any Alternate Assessment employed by the states.
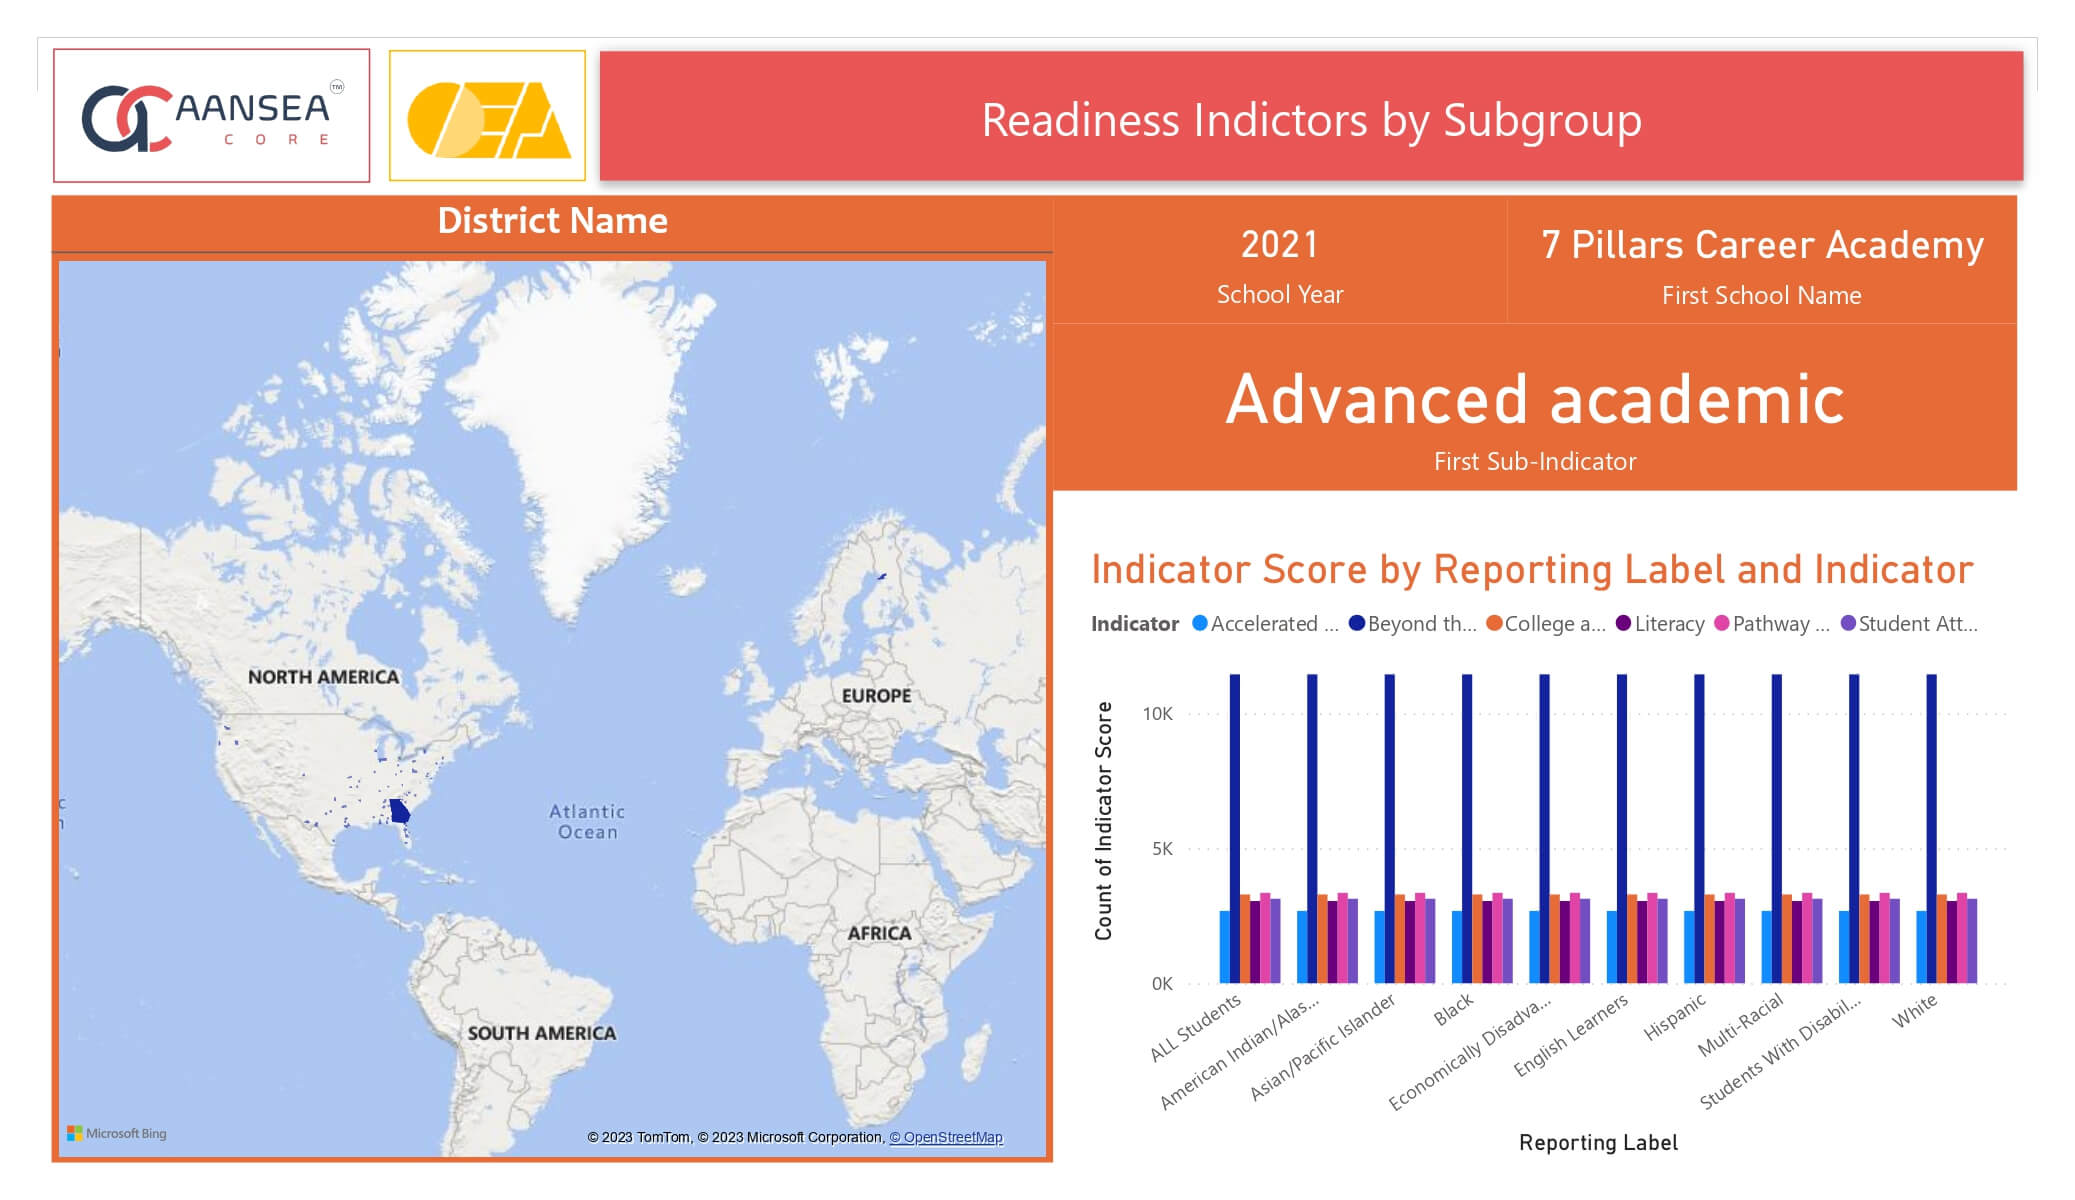
Readiness Indicator
Readiness indicators depict extent to which the students are participating in activities and gearing up for and showing preparedness for the next level, college, or career.
We’d love to talk about your project
Our experts and developers would love to contribute their expertise and insights to your potencial projects.

Contact Us
Your information will be kept strictly confidential and not shared with any third parties.